|
||
| class="Estilo34">Mexico and the World Vol. 5, No 2 (Spring 2000) http://www.profmex.org/mexicoandtheworld/volume5/2spring00/00boardman4.html
In the 1990's, Chile's new democratic government adopted an aggressive
free trade policy. Opening its economy to foreign investment it signed
15 bilateral, regional and multilateral trade agreements. Its economic
strategy hinged on increasing agricultural and natural resources exports.
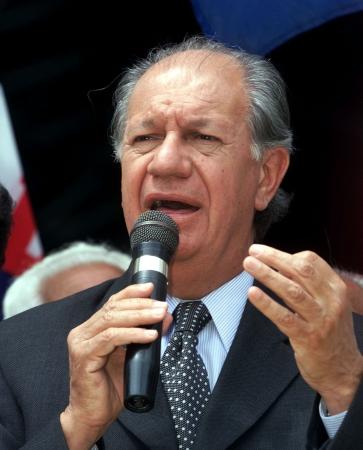
In 1999, Chile faced its first recession in sixteen years. Whether
it continues its aggressive foreign trade policy depends on how newly elected
Socialist President Ricardo Lagos decides to handle the economic crisis.
Lagos, elected in a very close second-round vote in January 2000, is the
first Socialist elected since the assassination of Salvador Allende in
1973.60
The 1999 Presidential
election is the third democratic election since the end of the military
government.61 Lagos’ victory ensured
the Concertación (PDC or Concertación de Partidos
por la Democracia) party's continued monopoly over the Presidency since
1989. The PDC's first nominee was Patrício Alywin
Azócar who served a four year term between 1989-1993. Eduardo
Frei Ruiz-Tagle, the PDC's second nominees was elected to a six-year term
extending from 1994-1999.62 Lagos, a
member of both the Alywin and Frei Administrations, will serve a term extending
from 2000-2004.63
The possibility of a Socialist administration
in Chile increased scrutiny by foreign investors. In mid-October,
the Wall Street Journal reported that the uncertainty created by
Chile’s presidential election was retarding its economic recovery.
While both Lagos and Lavín favored a free-market economy and competition,
there was specific concern regarding Lagos’ social policies emphasizing
labor and education. Under the last Socialist President, Salvador Allende,
Chile nationalized the banking sector and assumed control of key U.S. mining
investments such as Anaconda. Lagos dissenters pointed out that he
had strengthened his Socialist credentials by changing his position on
privatization of the government run copper conglomerate COLDECO.
As part of his strategy to assure foreign investors of his commitment to
the free-market, Lagos traveled to New York in the days following his primary
victory to meet with U.S. business investors. His agenda included
meetings with George Soros, David Rockefeller, Steve Forbes, and the Council
of the Americas. He adamantly insisted that he would continue to
support an aggressive trade policy that provides key government incentives
to Chile’s export sector.67
Since the overthrow of
Salvador Allende in 1974 foreign investment in Chile has been regulated
by the Chilean Foreign Investment Statute (DL 600) . Between 1974
and 1996, this law’s strict protection of foreign investor rights prompted
US$27 billion in foreign investments, an equivalent of more than 30% of
the 1995 GDP.68 In 1998, annual DL 600
investment totaled US$6.0 billion, a 14.6% increase from 1997.69
According to Chile’s Foreign Investment Committee, the United States is
the largest investor in Chile. Since 1974, it has invested over US$10.9
billion or 34.3% of total accumulated materialized foreign investment.
In 1996 the Chile-European Union regional trade agreement Has encouraged
Spain, the U.K. and the Netherlands to steadily increase their investments.70
Traditionally foreign investment has been primarily concentrated in the
mining and forestry sectors. New projects include electricity, telecommunications,
finance, insurance, and pension funds. Chilean Trade Agreements in the 1990’s Since the 1980’s, Chile's foreign trade policy has been particularly aimed at the elimination of tariff and other trade related barriers, as well as increased integration into the world economy. It has reduced quantitative restrictions, licenses on imports, and prohibitions while adhering to zero minimum customs valuation and no tariff surcharges. Chile’s trade policy is based on the following basic principles: Chile’s primary exports include copper, gold, silver, fresh fruit, lumber products, fish, and an increasing variety of manufactured goods. Chilean imports include machinery, cars, electronic products, capital-intensive goods, chemicals, and materials. As Tables 3-6 indicate, the largest markets for these products are Latin America, North America, Asia-Pacific Region, and Europe.
Trade treaties are the foundation of Chile’s assertive free-market trade policy. As Figure 3 outlines, in the 1990’s Chile signed 9 bilateral agreements in the Western Hemisphere, 5 agreements with regional trade blocs, and 1 multilateral agreement with the World Trade Organization (1994). Bilateral treaties were signed with Argentina (1991), Mexico (1991, 1998), Venezuela (1993), Bolivia (1993), Colombia (1993), Ecuador (1994), Canada (1998) and Peru (1998). Regional agreements include APEC (1994), European Union (1996), MERCOSUR (1996), and FTAA (1998).72
Chile & NAFTA After receiving an informal invitation in 1994
to join NAFTA, Chile proceeded to strengthen trade relations with all three
members of this trade bloc. Negotiations with the United States have
been the most contentious for Chile. Tables 3 and 4 and Figure 4
provide an in-depth analysis of U.S.-Chilean trade relations. Overall,
NAFTA is Chile’s third export market behind APEC and the European Union.
Between 1991-1998, Chilean exports to the United States increased steadily.
At the same time, imports from the United States rose at a greater rate,
making it the number one country from which Chile imports goods.
All three charts indicate that Chile needs to lowers its balance of trade
with the United States. This was one of the main reasons behind its
eagerness to join NAFTA.
During the course of NAFTA discussions with the United States, Chile also began negotiating agreements with Mexico and Canada. Chilean officials strengthened trade relations with Mexico and Canada for several reasons. First, they did so in anticipation of formally joining NAFTA. Second, as Alex Fernandez, president of the American-Chilean Chamber of Commerce noted, Chilean exports to the U.S. were beginning to suffer from competition with Mexican and Canadian exports. The Mexican and Canadian agreements gave the Chileans greater flexibility to export to these countries. It also gave them the option of shipping to these destinations, adding value to their product and then re-exporting it to the United States. The new product would have an origination in Mexico or Canada and thus enter the United States under NAFTA regulations, not U.S.-Chilean trade restrictions.73 In September 1991, Mexico and Chile agreed to implement an Economic Complementation Agreement (ECA) in January 1992. Under this accord, tariffs were lowered gradually from 10% in 1992 to 0% in 1998. In 1998, both countries agreed that they wanted to strengthen their trade relationship with a full trade agreement (FTA). Since implementation of the FTA in August 1998, trade and investment between the two countries has increased. Trade rose from an estimated US$158 million in 1990 to US$1.4 billion in 1997. Mexicans have invested in Chilean industries such as TV broadcasting, petrochemicals, financial services, textiles, and kitchen furniture. Chilean investments in Mexico include fruits, software, engineering, cold storage facilities, and surgical gloves.74 The Canada Chile Free Trade Agreement
(CCFTA) signed in December 1996 and implemented in July 1997 was Chile’s
first treaty with a G-7 nation. Under CCFTA, both countries agreed
to the elimination of tariffs and non-tariff barriers. Duty-free
status was granted to 92% of Chilean exports to Canada and 76% of Chilean
imports from Canada when the treaty was signed. CCFTA guaranteed
non-discriminatory treatment services and provided protection for foreign
investment.75 In addition to the
main agreement, separate labor and environmental agreements were also signed.
The Labor Cooperation Agreement specifically promotes productivity and
economic development in each country. The Environmental Cooperation Agreement
fosters the protection and improvement of the environment through sustainable
development. Both countries pledged to cooperate to develop and improve
environmental laws, regulations, procedures, policies and practices by
avoiding critical trade distortions or new trade barriers.76 Chile and the Asian Pacific Economic Cooperation (APEC) APEC is Chile’s number one export market due to the high volume of trade with Japan. As Tables 3 and 6 demonstrate, Japan accounted for approximately 17% of Chile’s total exports between 1994-1996. This figure surpassed exports to the U.S. during the same time period. This reflects, Chile’s concertedly efforts in the 1980’s to enter the Japanese market with its agricultural, forestry, and fish products. The Chileans developed extensive market research testing various agricultural products and recording which variants most appealed to the Japanese consumer.77 This market research was expanded to Korea and Taipei. In recent years, Chilean products have also generated interest in China, Indonesia, Thailand, Malaysia, Hong Kong, and Singapore. As Tables 4 and 5 indicate, Japan ranks fourth place for imports accounting for between 9% and 6 % during the time extending from 1994-1996. Chile has been one of the most aggressive Latin American countries promoting increased trade between Latin America and Asia. Along with Mexico, it was one of first Latin American nations to join APEC in November 1994. APEC is a consortium or forum of Pacific Rim nations informally organized to discuss the liberalization of trade. It is currently composed of 21 economies representing a diverse level of economic development.78 The group has been growing steadily since it was created in Australia in 1989 with only 12 members.79 APEC fosters discussions on tariff and non-tariff measures, services, investment, standards and conformance, customs procedures, intellectual property rights, competition policies, government procurement, deregulation, dispute mediation, and the mobility of business people. In September 1999, days prior to the formal
APEC Ministers meeting, officials from Asia and Latin America met in New
Zealand to form the East Asia-Latin American Forum (EALAF).80
Chile’s Eduardo Frei and Singapore’s Prime Minister Goh Chok Tong were
the strongest proponents behind organizing this first meeting.81
Its agenda was to promote economic, political and cultural ties and review
25 joint business development ventures. A total of 27 representatives
participated including six from Latin American nations that are not party
to APEC.82 Chile-European Union Relations Chile signed a regional agreement with the European Union (EU) in June 1996 that strengthens political dialogue and promotes trade liberalization, joint venture investments, and cooperation on scientific, cultural and technological projects.83 As a regional market, the EU is Chile’s number two export market. Tables 3 and 6 demonstrate that between 1994-1996, more Chilean goods were exported to the European Union than to North America. Individually, the European countries rank as fourth (United Kingdom), seventh (Italy), ninth (France), eleventh (the Netherlands), and twelfth (Spain). Together, these EU countries are a strong bloc that represent approximately 24% of all exports. This is greater than the U.S. share of Chilean exports, which averaged 17% during the same time period. According to Tables 4 and 5, Chile imports from Europe rank fifth (Germany), eighth (Italy), ninth (France), tenth (Spain), thirteenth (United Kingdom), and seventeenth (Sweden). As a group, the Europeans account for approximately 24% of all imports to Chile. Chilean imports from the U.S. stood at 24% during the same time period.84 In June 1999, Chile and the EU agreed to further
develop trade relations by creating a free trade zone that will begin to
lower non-tariffs barriers between late 1999 and 2001. Chile is hoping
that this agreement not only increases trade, but will also promote greater
European investment. According to Chile’s Foreign Investment Committee,
between 1974-1988 European foreign investment totaled 27.7% with including
financing from Spain (11.6%), the United Kingdom (5.9%), the Netherlands
(3.0%), France (1.6%), Finland (1.6%), Switzerland (1.4%), Italy (1.3%),
Germany (.7%), Belgium (.6%). In comparison, the United States invested
34.3%, Canada 16.4%, and Japan 3.6%. Chile-MERCOSUR Relations In 1996, Chile joined MERCOSUR as an associate member. Under this treaty, 33% of all trade between Chile, Argentina, Brazil, Paraguay, and Uruguay was liberalized. A gradual tariff reduction plan was agreed to that will eventually make 67% of Chilean exports and 62% of Chilean imports to and from MERCOSUR duty-free. All duties and tariffs will be eliminated by 2014. Since his election in January 2000, Chile's new President Ricardo Lagos has publicly announced that his administration will pursue negotiations with the make Chile a full member of MERCOSUR. As Tables 3 and 4 demonstrate, MERCOSUR is
Chile’s fourth largest market, behind APEC, the European Union, and NAFTA.
Inter-American Development Bank statistics in Tables 5 and 6 show that
Brazil is Chile’s third largest export destination. Argentina and
Brazil rank number 2 and 3 for imports behind the United States. Argentina
is also the main recipient of Chilean investment capital. A large
portion of the total US$11 billion Chile has invested is in the Argentine
energy sector.
60 Roberto de Andraca, “Las Elecciones No Pesan en las Decisions de Invertir,” El Mercurio Electrónico, 7 October 1999; “Segun Libertad y Desarrollo, A Lagos Lo Afecta Imagen de Político Tradicional,” El Mercurio Electrónico, 7 Sept. 1999; “ILD Prevé que Lavín Será el Próximo Presidente de Chile,” El Mercurio Electrónico, 7 October 1999. 61 It has been 10 years since Chileans
voted by a constitutionally mandated plebiscite to oust General Augusto
Pinochet from office. The vote was 55% in favor Pinochet stepping
down. Ricardo Torres-Mateluna, “‘The English Patient’ and Chile’s Political
Climate,” ISLA [1999] <http://www.igc.org/isla/chile3.html> 63 Lagos was Alywin's Minister of Education from 1990-1992 and Frei's Minister of Public Works from 1994-1998. 64 Ernest & Young International, “Executive Summary,” in Doing Business in Chile [1999] <http://www.doingbusinessin.com/chile>; Sebastian Edwards, “Chile’s ‘New Socialist’ Bids for the Presidency,” Wall Street Journal, 4 June 1999; and Kevin G. Hall, “Crises Dim Prospects For Americas Free Trade,” Journal of Commerce, 5 Feb. 1998. 65 “ILD Prevé que Lavín Será el Próximo Presidente de Chile,” El Mercurio Electrónico, 7 October 1999, “Lagos Confiado en que no Habrá Segunda Vuelta,” El Mercurio Electrónico, 19 October 1999. 66 Lavín studied civil engineering at Universidad Católica de Chile and received a masters in economics from the University of Chicago. He was editor of the economic and business sector of El Mercurio newspaper before running for public office. Joaquín Lavín Infante, Biografia [1999] <http://www.joaquinlavin.cl/seccion/Biografia/biografia.htm> 67 David J. Rothkopf, “Whistle-Stops on Wall Street,” New York Times, 8 March 1999. 68 Embajada de Chile en Estados Unidos, Chile Facts on Demands, Foreign Investment (Washington, D.C., 1999). 69 ProChile, Chilean Trade Commission, Foreign Investment and Trade Policy [1999] <http://www.chileinfor.com> 70 ProChile is the Chilean Trade Commission, which is responsible for promoting Chilean exports throughout the world. It has 38 Trade Offices around the world. Its mission is to identify demands for foreign products and to provide information to facilitate foreign investment in Chile. For more on ProChile’s efforts in the United States see <http://www.chileinfo.com> and for more on the overall organization review ProChile’s headquarters website in Santiago at <http://www.prochile.cl>. 71 Embajada de Chile en Estados Unidos, Chile Facts on Demand, Foreign Investment (Washington, D.C., 1999). 74 Embajada de Chile en Estados Unidos, Trade & Investment Between Chile and the United States (Washington, D.C.: 1999) and ProChile, Chilean Trade Commission, Foreign Investment and Trade Policy [1999] <http://www.chileinfor.com> 76 Canadian Embassy in Chile, Commercial Division, Summary of the Canada and Chile Bilateral Free Trade Agreement, Santiago, 1998 <http://www.dfait-maeci.gc.ca/santiago/stago-06b1-e.htm> ; Canada, Info Export, Opening Doors in Neighboring Countries: the CCFTA and Access to Latin America, January 1998 <http://www.infoexport.gc.ca/market/3rd-e.thm>; Canada, Info Export, The Canada-Chile Free Trade Agreement Overview, September 1998, <http://www.infoexport.gc.ca/market/50226-e.htm>. 77 Neantro Saavedra-Rivano, "Chile and Japan: Opening Doors Through Trade" in Barbara Stallings and Gabriel Székely, eds., Japan, the United States and Latin America. Toward a Trilateral Relationship in the Western Hemisphere? (Baltimore: Johns Hopkins University Press, 1993), 191-209. 78 The Asian Pacific Economic Corporation (APEC) includes Australia, Canada, Chile, China, Hong Kong, Indonesia, Japan, Korea, Malaysia, Mexico, New Zealand, Papua New Guinea, Peru, Republic of the Philippines, Russia, Singapore, South Korea, Taipei, Thailand, United States, Vietnam. 79 APEC began in 1989 with 12 countries: Australia, Brunei, Canada, Indonesia, Japan, Malaysia, New Zealand, the Philippines, Singapore, South Korea, Thailand and the United States. In 1998, following admission to Peru, Vietnam, and Russia, membership was closed until 2008. “Russia, Peru and Vietnam Enjoy Their First Summit,” AP, 18 November 1998. 80 Asian countries participating in the forum were Brunei, Cambodia, China, Indonesia, Japan, Laos, Malaysia, Myanmar, the Philippines, Singapore, South Korea, Thailand, and Vietnam. Latin American countries participating were Argentina, Bolivia, Brazil, Chile, Colombia, Ecuador, Mexico, Panama, Paraguay, Peru, Uruguay, and Venezuela. Australia and New Zealand also joined the talks. 81 Chile’s Eduardo Frei and Singapore’s Goh Chok Tong set the agenda for the first meeting and scheduled the next meeting for early 2001 in Santiago, Chile. 82 “Globalization Opens Way For Ties Between Asia, Latin America,” AP, 1 September 1999; “Asian, Latin American Countries Vow To Build Ties,” AP, 3 September 1999; and “Asia-Pacific Seeks Common Ground For Trade Talks,” Reuters, 10 Sept. 1999. 83 Embajada de Chile en Estados Unidos, Trade & Investment Between Chile and the United States and ProChile, Chilean Trade Commission, Foreign Investment and Trade Policy [1999] <http://www.chileinfor.com>. 84 ProChile, Chilean Trade Commission, Foreign Investment in Chile By Country 1974-1998, [1999] <http://www.chileinfo.com/trade/trade_finvest03.html> |
||||||||||||||||||||||||||||||||||||||||||||||||||||||||||||||||||||||||||||||||||||||||||||||||||||||||||||||||||||||||||||||||||||||||||||||||||||||||||||||||||||||||||||||||||||||||||||||||||||||||||||||||||||||||||||||||||||||||||||||||||||||||||||||||||||||||||||||||||||||||||||||||||||||||||||||||||||||||||||||||||||||||||||||||||||||||||||||||||||||||||||||||||||||||||||||||||||||||||||||||||||||||||||||||||||||||||||||||||||||||||||||||||||||||||||||||||||||||||||||||||||||||||||||||||||||||||||||||||||||||||||||||||||||||||||||||||||||||||||||||||||||||||||||||||||||||||||||||||||||||||||||||||||||||||||||||||||||||||||||||||||||||||||||||||||||||||||||||||||||||||||||||||||||||||||||||||||||||||||


Copyright © 2000 - 2009 PROFMEX. All rights reserved